Canada
Competence center for mining & mineral resources
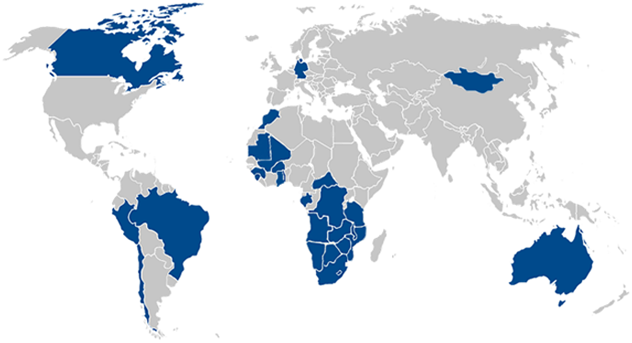
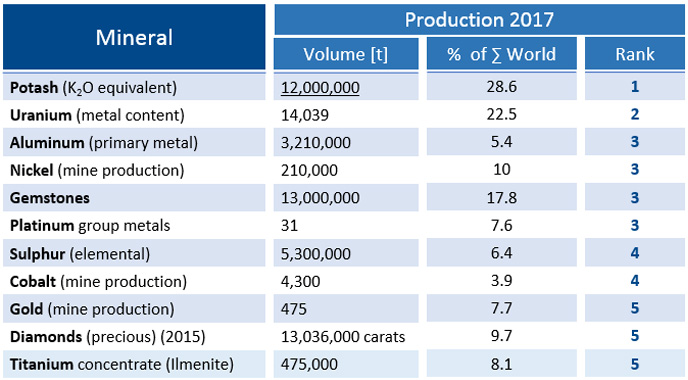
Figure 2: Mineral Production Canada (The Mining Association of Canada, Facts and Figures 2018)
Resource Supplier of World Rank
Canada is one of the leading mining countries in the world, producing more than 60 minerals and metals. Canada ranks among the top five countries in the global production of potash, uranium, niobium, cobalt, aluminum, platinum, nickel, sulphur, titanium, diamonds, and gold with an overall value of nearly $44 billion in 2017.
Seven minerals produced in Canada were in the top 3 of global production in 2017. Richly endowed with natural resources, Canada ranks among the top five countries in the global production of 16 major minerals and metals (see figure 2):
- First in potash
- Second in Uranium, Niobium
- Third in Nickel, Aluminum, Gemstones, Indium, and Platinum group metals (PMG)
- Fourth in Cobalt, Cadmium, Graphite, and Sulphur
- Fifth in Diamonds (Third in value), Gold, Titanium, and Mica
Supplier for Strategic Metals
As one of the leading mining countries worldwide Canada presents great business opportunities and strategic advantages for Germany. For further information on strategic metals produced and explored in Canada please also have a look at our research study on “Opportunities for German Companies in the Canadian Mining Sector” (German).
According to the German Mineral Resources Agency (DERA), Germany aims to secure future supply at reasonable cost for the following commodities with high criticality (supply risk & vulnerability of the German economy): Antimony, Bismuth, Chromium, Cobalt, Gallium, Germanium, Indium, Heavy and Light Rare Earth Metals, Niobium, Palladium, Platinum Group Metals PGM, Rhenium, Silver, Tin, Tantalum and Tungsten.
Canada ranks in the top five producing countries for strategic metals, including cobalt, PGMs (Platinum group metals) and tungsten and could supply these metals to Germany. Lithium, which has seen a recent surge (together with cobalt) due to rising demand in battery manufacturing for electric vehicles, is also being explored and developed in Canada.
Cobalt
Canada is the fourth largest Cobalt producer worldwide with 4,300t and a 3.9% market share (2017). As of 2017, there are 8 open pit and underground mines in Canada that produce Cobalt (as a by-product). Three of those are in Ontario (Redstone Project, Sudbury Operations, and Lockerby) and two in Manitoba (Manitoba Division, Manigo). Fortune Minerals is advancing a late-stage development project that will also produce cobalt as a by-product.
The main application of Cobalt is the production of high performance alloys or Super alloys. They are not only corrosion and wear-resistant, they also have extremely high temperature stability. These properties make them an essential ingredient in today’s turbine engines and in batteries for electric vehicles. A recent surge in the cobalt market has been attributed to the growing demand for batteries by companies such as Tesla. Certain Cobalt based alloys, like Vitallium (65% Cobalt), are also used in dentistry, prosthetics and joint replacement.
Tungsten (Wolfram)
In 2014, Canadas Tungsten production totaled 2,200t (2.7% of World Market) but after North American Tungsten closed its Cantung mine in October 2015, Canadas Tungsten production hit zero in 2016.
The Sisson Mine Project by Northcliff Resources which is located 60km northwest of Fredericton received their environmental assessment approval in early 2017. This roughly CAD$ 580 million project is expected to create around 300 jobs and help Canada and North America to secure a safe and long-term access to Tungsten.
Nearly 50% of all produced Tungsten is used in the production of hard metals. The main constituent is tungsten monocarbide (WC), which has hardness close to diamond. Tungsten has the highest melting point of all metals and is therefore alloyed with other metals to strengthen them. Hard metal tools are the workhorses for the shaping of metals, alloys, wood, composites, plastics and ceramics, as well as for the mining and construction industries. Other applications include a widespread variety of chemical uses.
Platinum Group Metals (PGM)
With 31,000Kg production volume and a 7.6% market share (2017), Canada is the third largest producer worldwide. Two of the most common Platinum Group Metals (PGM), Palladium and Platinum, are currently being mined in Canada. PGM’s include Ruthium, Rhodium, Palladium, Osmium, Iridium and Platinum.
Palladium is currently mined at three Canadian locations: Lac des Iles mine, Ontario (primary commodity) and Moshkinabi Mine, Ontario and Shakespeare Mine, Ontario (by-product). Platinum is a by-product of Nickel and Copper mining and is currently produced in Lac Des Iles (ON), MacWatters (ON), Moshkinabi (ON), Dumont (ON) and Sudbury Operations (BC).
The main application (61%) of Platinum and Palladium today is Vehicle emission Control (Catalysts) because it allows the complete combustion of low concentrations of unburned hydrocarbons from the exhaust into carbon dioxide and water vapor. The second Largest (12%) is Jewelry since it is rarer than both gold and silver.
Lithium
Canada lost its spot in the top 5 of the world’s Lithium producers and currently has two open pit Lithium mines in Quebec (James Bay and Whabouchi). Additionally, there are several advanced Lithium projects in Quebec (Canada Lithium Corp., Nemaska Lithium, Lithium One / Galaxy Resources, Critical Elements Corp.) and Ontario (Avalon Advanced Materials) being developed as demand is rising mostly due to increased battery production for electric vehicles, one important use of Lithium.
Other important applications of lithium are in the glass and ceramics field and in the production of aluminum. Lithium carbonate is added to glass to make it stronger. Producers of aluminum use lithium carbonate in preparing aluminum metal from aluminum oxide. Another important compound of lithium is lithium stearate. Lithium stearate is added to petroleum to make thick lubricating grease. Lithium greases are used in military, industrial, automotive, aircraft, and marine applications. Lithium stearate is also used as an additive in cosmetics and plastics.

Rare Earth Elements (REE)
Furthermore, Canada has several advanced Rare Earth projects. 11 Canadian REE projects are in an advanced exploration stage, all of which are Canadian owned. Frontrunners among Canadian juniors despite current market conditions and difficulties in obtaining financing are
- Avalon Rare Metals Inc. (Nechalacho Project)
- Pele Mountain Resources Inc. (Eco Ridge Project)
- Quest Rare Minerals Ltd. (Strange Lake Project)
- Matamec Explorations Inc. (Zeus-Kipawa Project)
Rare earth metals and alloys that contain them are used in many devices that people use every day such as computer memory, DVDs, rechargeable batteries, cell phones, catalytic converters, magnets, fluorescent lighting and much more.
Several pounds of rare earth compounds are in batteries that power every electric vehicle and hybrid-electric vehicle. As concerns for energy independence, climate change and other issues drive the sale of electric and hybrid vehicles, the demand for batteries made with rare earth compounds will climb even faster.
Rare earths are used as catalysts, phosphors, and polishing compounds. These are used for air pollution control, illuminated screens on electronic devices, and the polishing of optical-quality glass. All of these products are expected to experience rising demand.
Important Mining Clusters
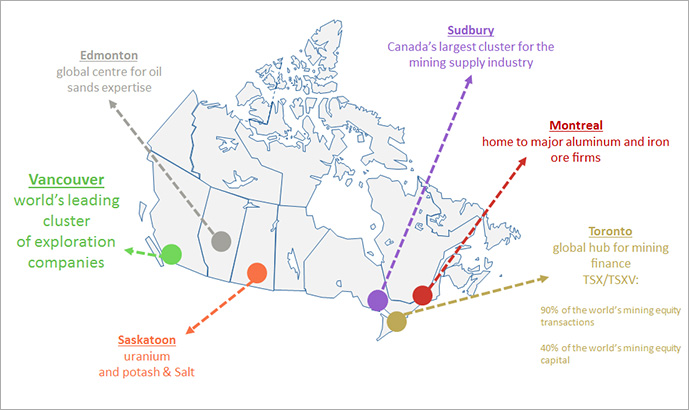
Figure 4: Canada’s Mining Cities
The Canadian Mining Industry forms several clusters around Canada’s major cities depending on the resource concentration within the different Canadian provinces.
With about 1,200 exploration companies, Vancouver is a global centre of expertise in mineral exploration. Companies based in British Columbia conduct exploration work all over the world.
Saskatoon is the focal point for companies in the uranium, salt and potash production. Edmonton gathers the oil and gas industry due to the proximity to the Athabasca oil sands, whereas most iron ore and aluminum firms are located in Montreal. Iron ore production concentrates in the area due to the richness of iron ore in the Labrador belt and major aluminum production facilities are located in Quebec due to low electricity prices. Sudbury is known for its mining supply cluster while Toronto is a global hub for mine financing due to the Toronto Stock Exchange.
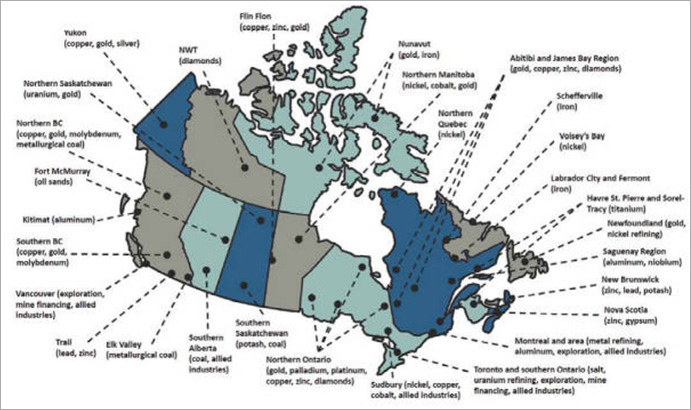
Figure 5: Mining clusters in Canada detailed
(Source: Natural Resources Canada; Compiled by The Mining Association of Canada)
Other clusters exist based on the geological preconditions and the concentration of certain minerals and metals (see figure 5).
To point out a few, the Northwest Territories is the country’s dominant source of diamonds and also home to Canada’s Cantung tungsten mine. Ontario and Quebec are leading in the country’s production of gold. British Columbia dominates in the production of metallurgical coal and also hosts Canada’s molybdenum deposits. Newfoundland and Labrador and Quebec produce virtually all of Canada’s iron ore. Several provinces have strong copper and nickel production, the Sudbury Basin in Ontario is world famous of its nickel deposits. Important mining locations such as Red Lake (Ontario), Timmins (Ontario) and Val d’Or (Quebec) are considered world class gold camps. Figure 3 below provides a detailed overview of Canadian mining clusters and mineral concentrations. Saskatchewan has one of the world’s largest uranium and potash deposits and hosts all of Canada’s uranium and potash mines.
Facts & Figures – Canadian Mining Industry
The Canadian mining industry is a major employer:
- In 2017, Canada had 1,189 mining establishments consisting of 63 metal mines and 1,126 non-metal mines. Provinces with the most metal mines are Quebec (21), Ontario (17) and British Columbia (8).
- Canada has one of the largest mining supply sectors globally with more than 3,200 companies supplying engineering, geotechnical, environmental, financial and other services to mining operations.
- More than 426,000 people across Canada work in the mining and mineral processing industries.
- Those who work in mining enjoy the highest wages and salaries of all industrial sectors in Canada with an average annual pay of $117,000, surpassing the earnings of workers in finance, manufacturing, construction and forestry.
- Mining is the largest private sector employer of Aboriginal peoples in Canada on a proportional basis, and employment is poised to increase.
The Canadian mining industry contributes to economic growth:
- The extractive industry as a whole, including mineral extraction and oil and gas extraction, contributed $152.1 billion, or nearly 8.6%, to Canada’s GDP in 2017.
- The extractive industry is the fourth largest of Canada’s 19 industries, surpassed only by the services, real estate and manufacturing sectors
- Mining alone contributed $58.4 billion to Canada’s Gross Domestic Product (GDP) in 2017.
- The industry accounted for 19% of the value of Canadian goods exports in 2017.
- Canada’s value of mineral production was nearly $44 billion in 2017.
- The mining industry’s payments to Canadian federal and provincial governments total more than $9.3 billion in taxes and royalties in 2017
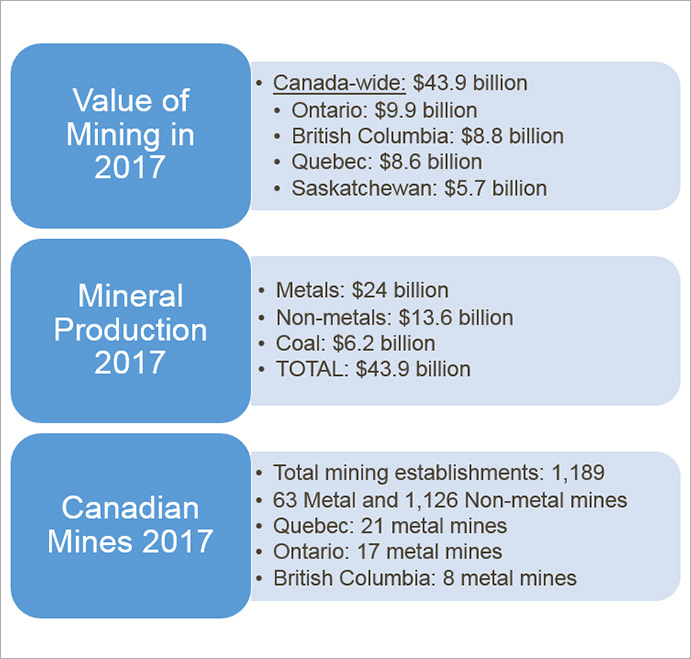
Figure 6: Facts Canadian resource market
(Source: Referring to The Mining Association of Canada – Facts and Figures 2018)
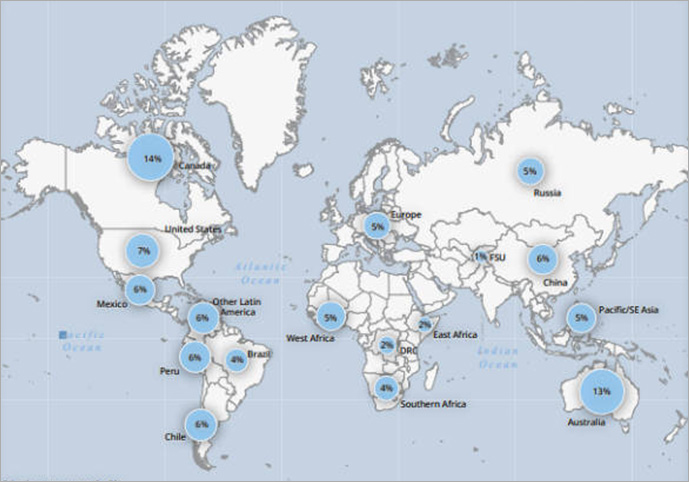
Figure 7: Worldwide Exploration Spending 2017
(Source: S&P Global Market Intelligence for the PDAC International Convention,
Worldwide Mining Exploration Trends, 2017)
Trends in Mining Development
& Exploration Spending
Globally, Canada has been the top destination for mineral exploration investment for 20 of the past 36 years. SNL Metals Economic Group’s Exploration Analysis shows that Canada reaffirmed its leading role in global exploration investment with $1.84 billion in 2017, equalling 14% of the expenditures worldwide (see figure 7). This constitutes the first increase, roughly 15% YTY, after decreasing between 2014 and 2016.
Furthermore, Canadian companies also have a strong global presence in exploration. More than 800 Canadian companies are actively exploring outside of Canada in over 100 countries. Hence, Canadian firms also account for the largest share of exploration spending not only in Canada, but also in the United States, Central and South America, Europe and, most recently, Africa (SNL Metals Economic Group, Natural Resources Canada).
Looking at more trends in exploration spending within Canada, it stands out that precious metals continue to attract the lion’s share of Canadian exploration spending in 2016, accounting for 60% overall spending. Base metal exploration’s share of total investment remained relatively stable, with a 13% share in 2016. Figure 8 provides an overview of the share of exploration budgets of the most important minerals and metals explored and mined in Canada.
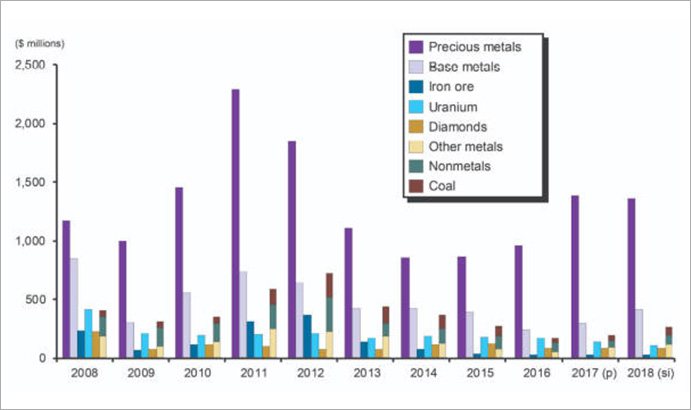
Exploration Spending Trends in
Canada 2008-2018
However, figure 8 also indicates that when looking at mid-term exploration spending trends, across the board expenditures are on a sharp decline. Following the current downturn in commodity markets, overall exploration investment has seen a sharp decrease globally since 2011 (see figure 9). This continued downward trend coincides with a period of declining prices across a broad range of mineral commodities, a persisting dim market outlook, an unfavourable capital market for financing mineral exploration, and, as a result of these circumstances, the adoption of measures by companies to trim costs and focus efforts on core assets.
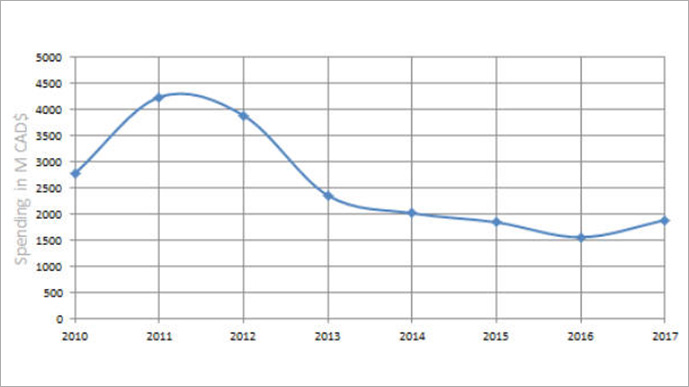
Figure 8: Canadian Exploration Trends, Source: Natural Resources Canada
Exploration Spending Trends in
Canada 2010-2017
In 2016 alone, Canada experienced a 18% decrease in exploration spending compared to 2015, marking the fifth year in a row in sharply decreased exploration spending. Figure 8 visualizes this overall trend, indicating that Canadas total exploration spending dropped by nearly 56% between 2011 (CAD $4,227.4 Billion) and 2015 (CAD$1,867.3 Billion). Although the total amounts differ slightly between data sources, looking at exploration expenditures by province over the past two years, the downward trend is also clearly visible.
Canadian Exploration Expenditures by Province 2016-2018
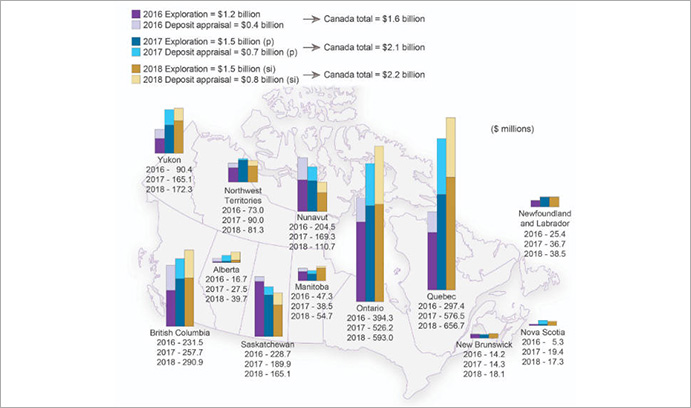
Figure 10: Exploration Expenditure Trends 2016-2018,
Source: Natural Resources Canada
Consequently, while precious metals (mainly gold) remains the leading commodity group with shares of total spending of 60% and 65%, respectively, in 2016 and 2017, decreases in dollar terms are notable.
Precious-metals expenditures have dropped from a peak of $2.3B in 2011 to $776M in 2015. Spending increased in the subsequent years, hitting $1.4 B in 2017 and is projected to stay at this level throughout 2018.
As the second-ranked commodity group, the base-metals category fell 21% in 2015 to $330M, but recovered and increased again by 21.9% to $294M in 2017. Additional growth is expected in 2018 by 38.4% to total $406.9M.
Looking at iron ore exploration in Canada over the last decade (2004 to 20014), the sharp decrease in the past year, from CAD$ 111.3M in 2013 to CAD$ 67.2M in 2014, due to tumbling iron ore price, becomes visible. Even though iron ore exploration had seen a dramatic increase between 2004 and 2011 and still, compared to 2004, has increased fivefold from 12.4M to 67.2M $CAD in 2014, compared to a decade ago, the outlook for iron ore is currently more doom than gloom.
Expenditures on iron ore increased 16.9% in 2017 to $26.8M. This is the first increase since prices peaked and expenditures reached record levels in 2011 and 2012 at over $300M.
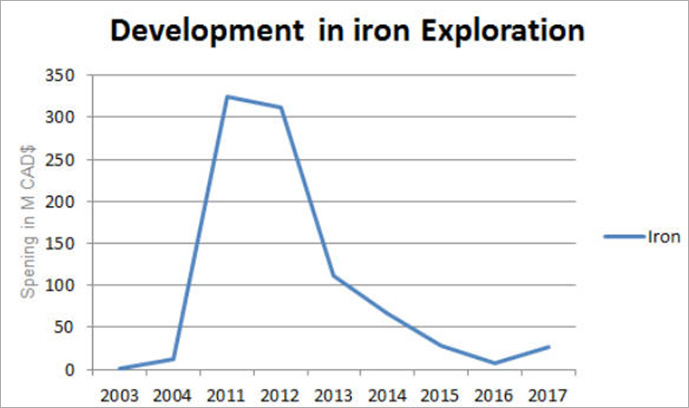
Figure 11: Trends in Iron Ore Exploration in Canada
Source: Referring to Facts & Figures 2017, Statistics Canada.
Base Metals followed a similar trend. The overall value in exploration spending doubled from CAD$ 241.3M in 2004 to CAD$ 416.8M in 2014. However, the most recent developments show a drastic decrease since 2011 (CAD$ 734.4M) down to CAD$ 209.7M in 2016. In 2017 on the other hand, expenditures increased by almost 22% to CAD$ 294M and are expected to grow an additional 38.4% to 406.9M in 2018.
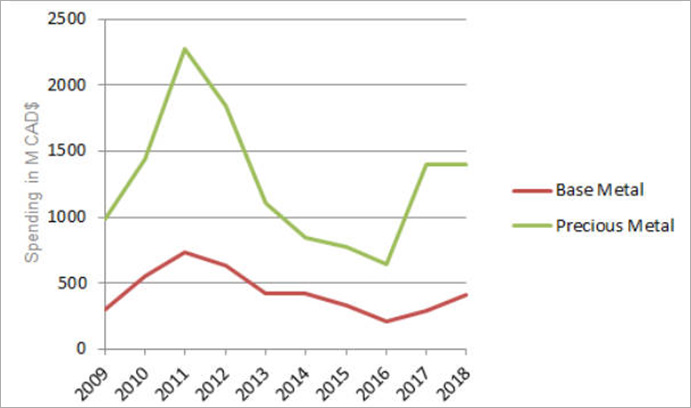
Figure 12: Trends in Iron Base Metal Exploration in Canada
Source Facts & Figures 2017, Statistics Canada
The impacts on the sector include a significant reduction in the number of active mineral projects (down one-third from the 2011 peak) and a number of projects reporting only minimal expenses related to maintaining mineral claims and leases in good standing and head-office expenditures aimed at keeping the corporate entity alive. This and other statistics from the latest survey underscore the ongoing struggle to conduct work programs that advance projects into later stages of development (Natural Resources Canada, March 2016; latest available data).
Furthermore, many companies are not able to remain on the market. Whereas the number of companies acting as project operators was 713 in 2014 and 598 in 2015, it is expected to further decrease to 480 in 2016. Since the record high of 911 in 2012, it is projected that 431 project operators will have become dormant, merged, or ceased to exist by 2016. Of this total, junior mining companies are anticipated to account for the vast majority (412) of lost project operators, highlighting the impact of current operating challenges on their ability to remain viable (Natural Resources Canada, March 2016; latest available data).
This trend is not limited to Canada alone, of course, but reflects a global economic trend or bear market. In a recent global study, SNL Mining & Minerals determined that, based on data from nearly 3,500 companies, worldwide exploration investment in 2016 fell to US$6.89 billion for non-ferrous metals. This is a 20% decrease from 2015, and a near 66% drop from the all-time record high of US$20.53 billion in 2012 (MAC, Facts &Figures 2017, SNL Financial).
According to Natural Resources Canada, the future for major mining project investments is very grim. Even though the commodity prices are on the rise, Capital investment has and still is declining since 2012. The fact that the federal environmental assessment registry only received two new mining project submissions only confirms this trend.
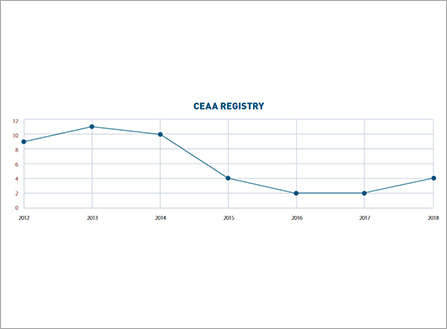
Figure 13: Canadian Environmental Assessment Agency
Source: Facts & Figures 2018
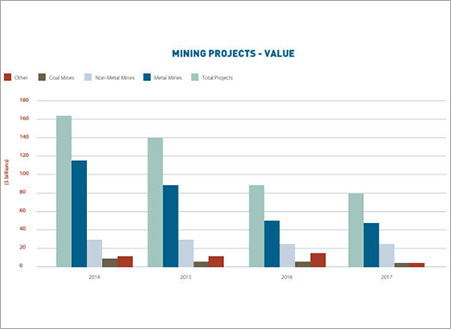
Figure 14: Values of Mining Projects by Year,
Source: Facts & Figures 2017
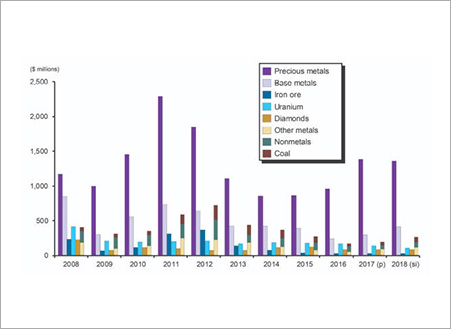
Figure 15: Total Capital Expenditures in Canada
Source: Facts & Figures 2018.
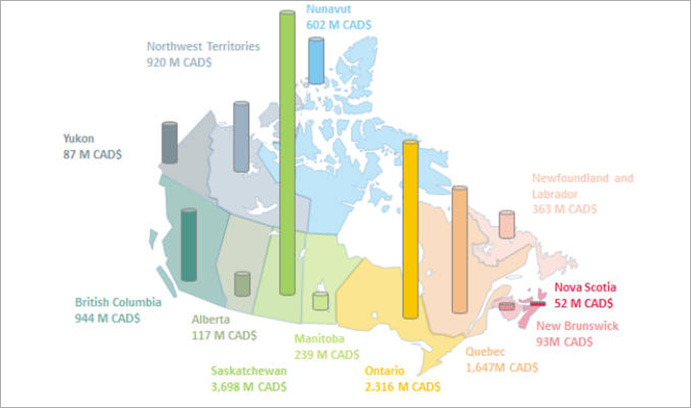
Figure 16: Total Capital Expenditures for Mineral Resource Development within Canada
(Source: The Mining Association of Canada – Facts and Figures 2017)
When looking at capital expenditures by Canadian province (see Figure 16) Saskatchewan stands out as the province with the highest capex in 2016. While roughly $ 196M was spent on exploration, Mine Complex Development accounted for the remaining whopping $ 2.34B. Saskatchewan is home to all of the four Canadian uranium mines (producing 22% of global market share) and has recently seen extensive investments into two new potash projects, BHP Billiton’s Janson Mine project ($ 3.7B) which is still in development, and German based K+S’ Legacy Project solution mine ($ 4.1B), which was opened and renamed to “Bethune” in May of 2017. Ontario and Quebec have historically been strong mining provinces in Canada with a large number of existing gold and metal mines. Gold has been doing comparatively well and accounts for a substantial amount of the capex in these provinces.